– By Austin McAlexander
SealingTech is proud to provide our customers and mission partners with industry leading carry-on compliant server hardware while maintaining the performance characteristics of traditional data center hardware. This involves an entire Research & Development team at SealingTech from Systems Engineering, Electrical Engineering, Design Engineering and Mechanical Engineering.
A question we often hear is, “How is SealingTech able to cool all of the components such as an NVIDIA A100 AI Accelerator or the latest generation of AMD EPYC CPUs?” This blog post will cover our use of thermal simulation software during our product development lifecycle and discuss how it helps increase the speed of prototyping, allowing us to quickly deliver the latest technology to our customers.
Once a CAD design reaches a state of completion, meaning the team and stakeholder have approved it, it is ready to go into our simulation software. Computational Fluid Dynamics or “CFD” is a software that allows us to visualize airflow and thermal patterns within a set flow volume. By setting the inside of the server to be the flow volume, we can visualize how the air moves within it and how it interacts with the heat producing components. This has become an important step of our design process.
1. Simplified model ready to be uploaded to CFD software
Firstly, the simulation shows any major design flaws that could have gone unnoticed up to that point, as well as something invisible to the naked eye. It also gives another medium to compare different designs the team may be stuck between. Finally, it gives the team an advantage in the first round of prototype testing. If we know something may be an issue, it can be tackled quicker and get testing back on track.
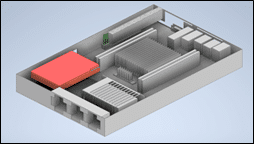
When building a model for testing, essentially what is created is a minimalist version of the chassis and its insides. For the best results, we need to get rid of any small parts and features that will not affect the outcome of the simulation. Parts like screws, captive fasteners, and the grate patterns of vent holes have minimal effects on a simulation and do nothing but slow the process down. Thus, they are deleted, and we end up with something like Figure 1.
Once a minimal version of the chassis is complete, we combine it with the original in a separate assembly. We check for any overlaps and any small faces/gaps, and get rid of them, as they can create anomalies that cause a run to fail.
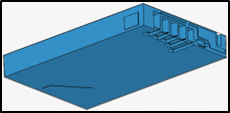
2. Rear view of a flow volume
Finally, we create a flow volume (Figure 2), which tells the program where the inside of the chassis is so the simulation knows where fluid can go. This is exported to the simulation section of the program.
Once we have our model prepped, it’s time to start running the simulations. There are two main types of simulations we run on the models. These are Incompressible Flow (IF) and Conjugate Heat Transfer (CHT). IF is an analysis of purely the flow of the model, while CHT integrates fluid flow and heat transfer between the fluid and the power producing components. Each of these serves a very important purpose in the larger scope of testing.
We first focus on IF to get an idea of how the air flows within the chassis and get a general idea of what we can do to optimize the model and flow. The IF is a much computationally cheaper process, so it makes sense to use this step to optimize and tinker with the flow first, then transition to CHT, which takes much longer to run. The IF phase is where we experiment with things like baffles and vent placement.
The process allows us to run multiple trials under different conditions to ensure the most efficient format possible. The CHT model brings in power and heat producing components, which energizes the air and changes the velocity at different points. While there are slight differences in the flow between an IF and CHT model due to the heat added to the system, the general shape and direction of the flows are the same. This means we can make assumptions the IF model flow will translate over to CHT.
For the experimental setup, we assign material properties to each component to match their real material. These come from an included database, as well as a range of custom-created materials. This more accurately models heat flow on components like the motherboard and RAM sticks.
There is also a feature that allows us to model a fan more accurately as a boundary condition. Since the flow rate of fans is affected by the pressure within the chassis, we can use the data sheet provided with each fan to create a “flow vs. pressure” table and have the simulation use that to calculate fan flow into the model. We set the vent holes to a 0-pressure outlet boundary condition.
The last step of setup is to speak with the team to find the highest power-producing components and their wattage to assign them to their simulation representations as power sources.
Once the simulations are run, we transition into the post-processing phase. The post-processing features of the CFD software are robust, while also remaining highly user-friendly and easy to use. Results can be measured in multiple ways. For IF, we look at the particle flow. A group of particles are dropped at the inlet, and are analyzed for their velocity and direction. It’s like tracking a single piece of dust flowing through the chassis and analyzing its movements and repeating from different locations. We still use particle traces for a CHT transfer, but it is most important in the IF phase.
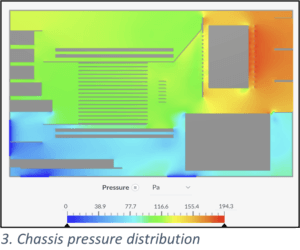
 For CHT, one of the first steps is taking surface temperature averages of the different heat-producing components. This gives a snapshot of the thermal loads on different faces and bodies. The next data point is the static pressure of the case (Figure 3), which is visually analyzed by taking screenshots of the case with a set pressure range.
Finally, we look at flow rates through different areas of the case. We record the overall flow rate, as well as the flow rate through high importance areas, such as the CPU heatsink. This could be done in the IF phase, but due to the thermal loads the CPU and other components see, it’s important we wait until heat is a factor, because these areas are where we can see the most discrepancies between the two.
Using CFD software, we have learned quite a bit about server air flow, and how we can better design our chassis because of it. The biggest goal is creating efficient air usage in the server. We want a high percentage of air being pumped by the fans to reach heat-producing components. We aim to create as compact a server as possible, so adding a bulky fan is out of the question. This means that efficient usage of air is paramount to optimal cooling.
We have learned a few lessons on how this can be done. The first one being: more vent holes does not always equate to better cooling. The chassis is a high-pressure system, and the outside world is a low-pressure system. This means the air is going to be sucked out of the vent holes, rather than being blown out of them. We have learned to be more strategic with where we place our vent holes, to pull the air where we want it to go and block off where we don’t want it to go.
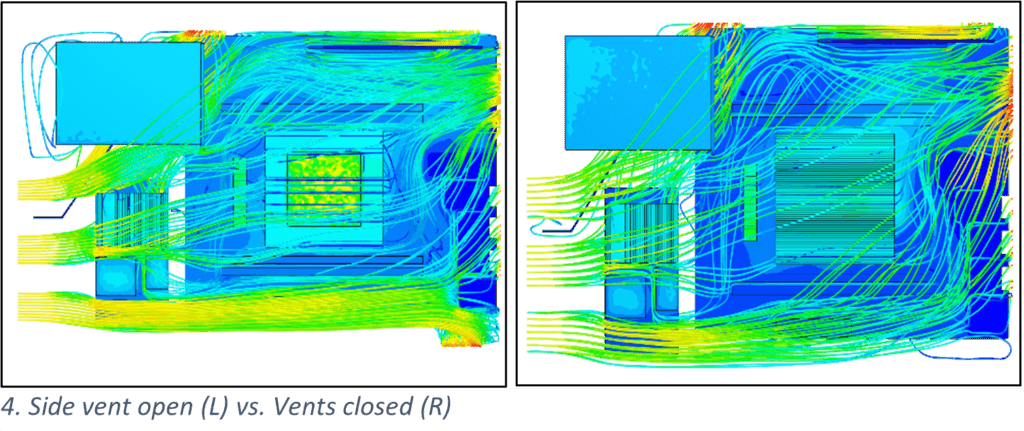
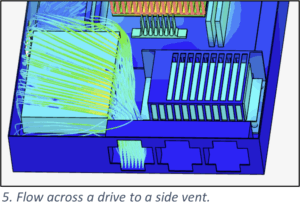 For example, on all our chassis with a single drive tray, we add vent holes to the chassis closest to the drive. This pulls air across the drive, cooling it without the need of a baffle (see Figure 5). Conversely, in another design we had vent holes that were pulling air away from the rest of the chassis (Figure 4). The left design with vent holes pulled air away from the CPU, and when they were eliminated, air was free to be pulled to the back of the chassis and across the CPU.
This leads into another design goal of using baffling to create sections of low-pressure, high-velocity air in areas of high thermal load. These high-load areas, such as the CPU, function more efficiently with higher levels of airflow pulling hot air away. This can be created by baffling a high-velocity zone around the component, which in turn lowers the pressure, and pulls even more air in. This effect is seen in Figure 3, with a sharp contrast in air pressure in the area before and after the baffling.
 The best air is efficient air, so we are constantly checking the flow rate through the course of simulation runs to ensure that we are using it as efficiently as we can. Flow=area*velocity, and since we cannot change the area of the common off-the-shelf components we have, higher velocity air is needed for better cooling.
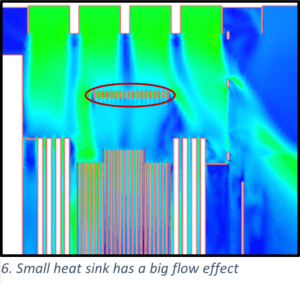
As our comfortability with the program gets better, so does the accuracy of the simulations we are able to run. Smaller heatsinks and even some larger wiring looms have large effects on flow characteristics, which can have huge cooling effects down the line. These smaller features can be added without compromising simulation runtime. In Figure 6, the small heatsink circled in red has a huge effect on the velocity of the air going past it. It creates a shadow of slow air behind it, as shown by the large patch of blue between two larger green sections. This represents an almost 50% decrease in the velocity of the air coming through it, which would have gone unnoticed had the small sink been cut out.
Additionally, we have pushed towards a data-driven approach to represent what can be seen through particle traces and pressure screenshots. We want to have hard numbers to back up the visual phenomenon we see to better understand how we can replicate it. The CFD software can measure flow through a plane, and we have used this to calculate the flow through a heat sink. This allows us to create rudimentary metrics on flow efficiency.
By comparing flow entering and exiting the heat sink, we can find the efficiency of the baffling that funnels air into it. We want air to flow through the entire sink unimpeded, as air that bleeds off into the rest of the chassis is not useful. “Baffle efficiency” is just the start of a data-driven approach we are taking going forward. While “the eye test” will always be useful for checking the overall shape of a flow, we want to rely on empirical data that shows “the why” on how some designs work and others don’t.
CFD findings are used to either change the CAD model or give the team the confidence to order a physical unit for hands-on assembly and testing. The capability to simulate reduces the time and number of prototypes necessary to get a product from concept/customer requirements into full scale production. Once a final production representative protype is ready, it goes to an independent testing lab where they preform various tests under MIL-STD testing MIL-STD-810G and MIL-STD-810H. Findings from these independent tests then help us make any final changes to the server to finalize it as a production-ready server.
CFD testing as a whole allows us to be more confident in our designs before we release them, and scope out any potential problems with cooling before a unit sees the customer. This gives the team a “method to the madness” for fans and baffles. Instead of just throwing vent holes all over the chassis, we are able to place them in the most efficient configurations, and have hard data to back up our decisions. CFD software is becoming commonplace in our industry when it comes to thermal testing, and for good reason. At SealingTech, it keeps provides important insights that ensure our products enter the field to give cyber warriors the best technology available.
Related Articles
Transforming Cyber Challenges into Real-World Customer Solutions
Intuitive and skilled problem solvers, SealingTech engineers design and build defensive cyber solutions for challenging and unpredictable environments where critical missions are at stake. They tackle issues that directly impact…
How Geopolitics Defines Cybersecurity for Critical Infrastructure
Geopolitics and cybersecurity increasingly converge. State-sponsored hackers target critical infrastructure as part of broader international competition. Governments use cyber operations for espionage, influence, and sabotage to apply pressure without kinetic…
Could your news use a jolt?
Find out what’s happening across the cyber landscape every month with The Lightning Report.
Be privy to the latest trends and evolutions, along with strategies to safeguard your government agency or enterprise from cyber threats. Subscribe now.